
Overview
NIMC’s enrolment figures as at January 11, 2025 currently stand at over 114.5 million unique records.
The highest cumulative enrolment figure of over 12 million was recorded in Lagos State.
Regional figures indicated an almost equal distribution across the North and South.
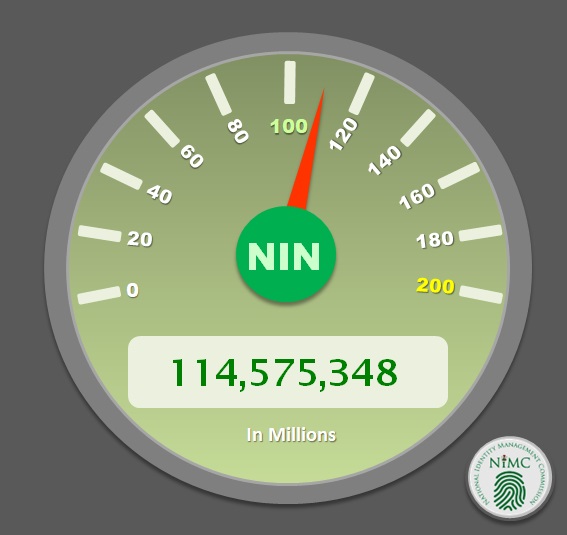
Total Enrolment Figure as at 11 January – 114,575,348 Enrolled
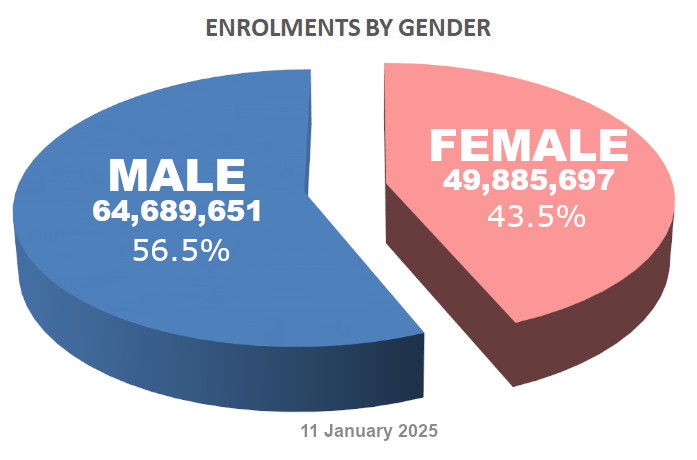
Enrolment Distribution by Gender – 11 January 2025
Enrolments in States as at 11 January 2025
Table contains columns for “States”, “Total Enrolments”, “Female” and “Male” – it can be scrolled horizontally on smaller screens of some devices.
| ENROLMENTS BY STATES & GENDER AS AT 11 JANUARY 2025 | |||
| STATES | FEMALE | MALE | TOTAL ENROLMENTS |
| Abia | 959,089 | 1,583,989 | 2,543,078 |
| Adamawa | 1,166,827 | 1,655,540 | 2,822,367 |
| Akwa-Ibom | 921,764 | 1,052,220 | 1,973,984 |
| Anambra | 1,347,515 | 1,451,497 | 2,799,012 |
| Bauchi | 1,127,409 | 1,901,094 | 3,028,503 |
| Bayelsa | 331,106 | 402,180 | 733,286 |
| Benue | 1,146,728 | 1,509,189 | 2,655,917 |
| Borno | 1,196,596 | 1,584,589 | 2,781,185 |
| Cross-River | 620,799 | 749,940 | 1,370,739 |
| Delta | 1,475,592 | 1,655,418 | 3,131,010 |
| Ebonyi | 443,238 | 528,652 | 971,890 |
| Edo | 1,203,312 | 1,405,208 | 2,608,520 |
| Ekiti | 567,246 | 556,349 | 1,123,595 |
| Enugu | 943,511 | 945,221 | 1,888,732 |
| Fct Abuja | 1,553,092 | 2,170,442 | 3,723,534 |
| Gombe | 850,418 | 1,214,740 | 2,065,158 |
| Imo | 960,317 | 1,017,823 | 1,978,140 |
| Jigawa | 1,210,961 | 1,734,937 | 2,945,898 |
| Kaduna | 3,043,576 | 3,745,125 | 6,788,701 |
| Kano | 4,189,333 | 5,682,246 | 9,871,579 |
| Katsina | 1,622,656 | 2,313,740 | 3,936,396 |
| Kebbi | 868,293 | 1,492,915 | 2,361,208 |
| Kogi | 880,883 | 1,012,174 | 1,893,057 |
| Kwara | 898,564 | 1,071,784 | 1,970,348 |
| Lagos | 5,627,165 | 6,742,802 | 12,369,967 |
| Nasarawa | 948,693 | 1,291,800 | 2,240,493 |
| Niger | 1,124,639 | 1,774,495 | 2,899,134 |
| Ogun | 2,313,473 | 2,514,472 | 4,827,945 |
| Ondo | 1,095,086 | 1,164,958 | 2,260,044 |
| Osun | 1,093,299 | 1,114,360 | 2,207,659 |
| Oyo | 2,129,754 | 2,310,535 | 4,440,289 |
| Plateau | 1,110,777 | 1,253,724 | 2,364,501 |
| Rivers | 1,560,393 | 1,870,873 | 3,431,266 |
| Sokoto | 753,914 | 1,765,279 | 2,519,193 |
| Taraba | 673,808 | 984,414 | 1,658,222 |
| Yobe | 673,399 | 1,155,433 | 1,828,832 |
| Zamfara | 704,290 | 1,418,151 | 2,122,441 |
| Diaspora | 548,182 | 891,343 | 1,439,525 |
| Total | 49,885,697 | 64,689,651 | 114,575,348 |
Top 10 States for NIN Enrolment as at 11 January 2025
| STATES | FEMALE | MALE | ENROLMENTS |
| Lagos | 5,627,165 | 6,742,802 | 12,369,967 |
| Kano | 4,189,333 | 5,682,246 | 9,871,579 |
| Kaduna | 3,043,576 | 3,745,125 | 6,788,701 |
| Ogun | 2,313,473 | 2,514,472 | 4,827,945 |
| Oyo | 2,129,754 | 2,310,535 | 4,440,289 |
| Katsina | 1,622,656 | 2,313,740 | 3,936,396 |
| Fct Abuja | 1,553,092 | 2,170,442 | 3,723,534 |
| Rivers | 1,560,393 | 1,870,873 | 3,431,266 |
| Delta | 1,475,592 | 1,655,418 | 3,131,010 |
| Bauchi | 1,127,409 | 1,901,094 | 3,028,503 |
Bottom 10 States for NIN Enrolment as at 11 January 2025
| STATES | FEMALE | MALE | ENROLMENTS |
| Akwa-Ibom | 921,764 | 1,052,220 | 1,973,984 |
| Kwara | 898,564 | 1,071,784 | 1,970,348 |
| Kogi | 880,883 | 1,012,174 | 1,893,057 |
| Enugu | 943,511 | 945,221 | 1,888,732 |
| Yobe | 673,399 | 1,155,433 | 1,828,832 |
| Taraba | 673,808 | 984,414 | 1,658,222 |
| Cross-River | 620,799 | 749,940 | 1,370,739 |
| Ekiti | 567,246 | 556,349 | 1,123,595 |
| Ebonyi | 443,238 | 528,652 | 971,890 |
| Bayelsa | 331,106 | 402,180 | 733,286 |
Enrolment Performance by States as at 11 January 2025